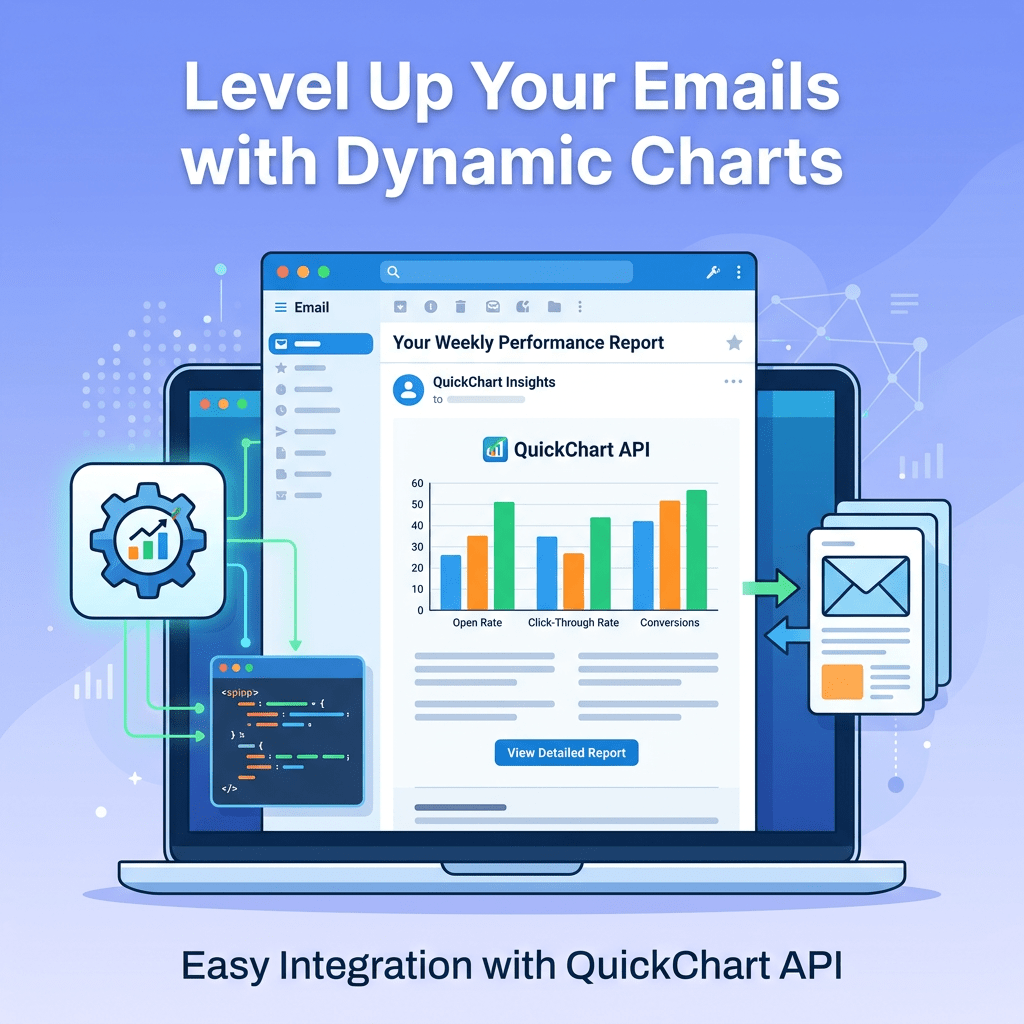

QuickChart is an open-source web service that generates chart images on the fly from a JSON configuration. Because the output is a plain image URL, it is compatible with any delivery channel that supports an <img> tag  including email, SMS, and chatbots. Charts are rendered server-side using Chart.js, ensuring consistent output across all email clients regardless of JavaScript support.

This article demonstrates how to generate personalised chart images per recipient using Adobe Campaign Classic EJS templating and the QuickChart API.

Getting Started

QuickChart works by parsing a Chart.js JSON configuration and rendering it as a PNG or SVG image. You can pass the configuration either as a URL parameter (GET request) or as a POST request body. For email use, the GET approach is simpler — build the chart configuration in an EJS block, serialise it with JSON.stringify, URL-encode it with escapeUrl, and embed the resulting URL in an <img> tag.

Basic Example — Bar Chart

The following code can be pasted directly into a delivery template. The chart configuration object is built in an EJS block, serialized, and embedded as the src of an img element. Data values can be replaced with recipient-level personalization variables from Adobe Campaign.

<HTML>
<head></head>
<BODY>
<div>

<%
var carbon = {
    type: 'bar',
    data: {
        labels: ['Average Investment', 'Sustainable Investment'],
        datasets: [{
            label:           'Tonnes of CO2 per year',
            data:            [11, 5],
            borderWidth:     1,
            backgroundColor: ['rgba(234, 82, 4, 0.2)', 'rgba(0, 121, 109, 0.2)'],
            borderColor:     ['rgba(234, 82, 4, 1)',   'rgba(0, 121, 109, 1)'],
        }]
    },
    options: {
        plugins: {
            datalabels: {
                anchor:          'end',
                align:           'top',
                color:           '#fff',
                backgroundColor: 'rgba(34, 139, 34, 0.6)',
                borderColor:     'rgba(34, 139, 34, 1.0)',
                borderWidth:     1,
                borderRadius:    5,
            }
        },
        legend: {
            labels: { fontColor: 'white' }
        },
        title: {
            display: true,
            text:    'Tonnes of CO2 per year'
        },
        scales: {
            xAxes: [{ ticks: { fontColor: 'white' } }],
            yAxes: [{
                ticks:     { beginAtZero: true, fontColor: 'white' },
                gridLines: { color: 'rgba(255, 255, 255, 0.1)' }
            }]
        }
    }
};

var link = 'https://quickchart.io/chart?bkg=rgb(0,42,94)&c=' + escapeUrl(JSON.stringify(carbon));
%>

<img width="600px" height="400px" src="<%=link%>"/>

</div>
</BODY>
</HTML>

Chart Types

QuickChart supports all Chart.js chart types. The following example demonstrates a radar chart rendered directly as an img tag:

<img src="https://quickchart.io/chart?c={
    type:'radar',
    data:{
        labels:['January','February','March','April','May'],
        datasets:[
            {label:'Dogs', data:[50,60,70,180,190]},
            {label:'Cats', data:[100,200,300,400,500]}
        ]
    }
}">

For a full list of supported chart types and configuration options, refer to the QuickChart documentation:

QuickChart documentation

QuickChart chart types

Self-Hosting

QuickChart is open source and can be self-hosted if you prefer to keep chart rendering within your own infrastructure. Deployment instructions are available in the GitHub repository:
QuickChart on GitHub

https://martech.network/
Do you like David Garcia's articles? Follow on social!

Login

Welcome! we are excited to have you.

Martech.network is an inspiring community where marketing automation experts unite to exchange innovative ideas, tackle challenges, and elevate each other. Our mission is clear: Unite minds, ignite creativity, and empower growth through digital innovation.
Registration